A lot of money is spent within the emergency management and homeland security enterprise. Looking just at the last couple of years of annual Homeland Security Grant Program (HSGP) (this is the annual grant provided by the US Federal government to states and urban areas), $1.044 billion was allocated in FFY 2015 and $1.043 billion allocated in FFY 2014. These billions of dollars only account for a portion of spending within EM/HS. There are other federal initiatives as well as state, tribal, territorial, and locally funded efforts. Businesses and NGOs also invest significantly in emergency management, homeland security, and business continuity activities. But where does it all get us?
Through the past decade or so there have been a few efforts by DHS/FEMA to try to measure preparedness, ideally to identify improvements in our preparedness as the result of the billions of dollars invested. None of these efforts have really provided obvious and tangible results. The current measure is through annual State Preparedness Reports (SPRs), which utilize the THIRA process (Threat and Hazard Identification and Risk Assessment) outlined in Comprehensive Preparedness Guide (CPG) 201 as a foundation, but with the POETE analysis (Planning, Organizing, Equipping, Training, and Exercising) for each of the 31 Core Capabilities. (You can find articles I’ve written on the utility and application of POETE here.) The SPR is a good methodology for identifying the current condition of preparedness for each state as viewed through the 31 Core Capabilities. The POETE analysis helps to identify the strengths and weaknesses within each Core Capability.
The SPR, however, still falls short. How can we improve it?
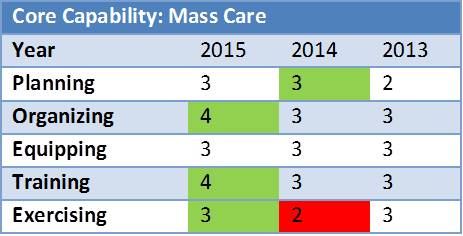
1. Include historical data for trend analysis. The SPR largely provides only a snapshot of current conditions. The format of the SPR does not provide for any analysis of historical data to identify trends (i.e. improvements or otherwise) in the state’s assessed condition of its 31 Core Capabilities. FEMA regional offices, upon receipt of an SPR, do provide a brief feedback report of the current SPR with a passing mention of the previous year’s submission, but the report provides so little information it could hardly be called an analysis.
A rudimentary table identifying trends for a selected Core Capability is below. For those not familiar, higher scores rate a higher measure of capability. In this table, I’ve identified POETE elements which have trended lower from year to year with a RED highlight, and those which have trended higher with a GREEN highlight. A simple analysis such as this give an at-a-glance comparison. To make this analysis more comprehensive, I would suggest the addition of narrative for each trend (higher or lower) which explains what has changed to warrant the new ranking.
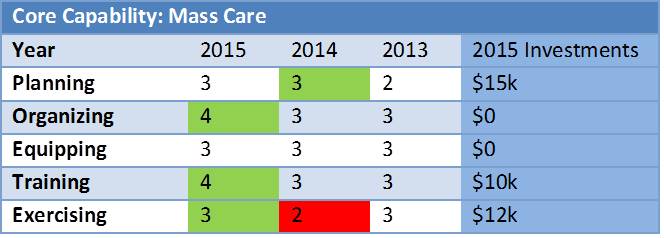
2. Include a financial analysis for the current year to identify return on investment. An identification and summary of key program area investments for the year will lay the groundwork for a return on investment (ROI) analysis. ROI will help identify how much bang for the buck you are getting in certain areas. It’s easy to lose sight through the year from a program management perspective on how much money was spent on certain programs and activities – especially for larger agencies with a layered bureaucracy. Incorporating this analysis into an SPR is not only good financial and program management, but provides an opportunity to identify where money was spent and to measure, at least on a broader scale, what the results were. Certainly we have to fund continued operations to simply sustain our capabilities, but we should also be funding, where possible, programs to enhance our high priority capabilities and those needing the most improvement.
Again, as a rudimentary example, we can build on the table provided earlier to identify where funds were spent to see if they made a difference in our level of preparedness. As with the earlier example, a narrative should be provided for each investment to identify what it was and assess the impact. This also provides an excellent opportunity to review the investment justification written for grants to determine if the investment met the intended objectives (which should have been to maintain or enhance some aspect of the capability). Historic investment data can also be included for each year. This all leads directly to identifying the return on investment – did the investment make a difference and to what extent?
Ultimately this added data and analysis requires more work, potentially the involvement of more people, and likely more time to complete the SPR. However, this new process will also result in a positive return on investment itself by helping to identify trends and outcomes. Financial information is regularly reported to DHS (for those grants that originate with them) in the form of progress reports, but that information is stovepiped and usually not associated with a more comprehensive assessment such as the THIRA/SPR. Bringing this data together paints a much more accurate picture.
The concept of preparedness is difficult to put in a box. It’s amorphic and challenging to identify, yet people often ask the question ‘Are we prepared?’ States, locals, DHS, and Congress often have difficulties measuring preparedness and advances in preparedness, especially relative to the dollars spent on it. The GAO has regularly recommended efforts to better identify return on investment, yet we haven’t gotten there. The recommendations identified here can bring us much closer to nailing down where we are and where we need to be. Armed with this knowledge, we can make better decisions for future investments and activities.
Moving forward, I expect to write a bit on each POETE element, with my thoughts on how we can identify return on investment for each. As always, I’m very much interested in your thoughts on the approach I identified above and how we can better identify return on investment in the realm of emergency management and homeland security.
If you are interested in utilizing this approach to better identify your return on investment for local, state, tribal, territorial, or organizational preparedness efforts (whether or not you do a State Preparedness Report), Emergency Preparedness Solutions is here to help! Check out our website at www.epsllc.biz or contact me directly to discuss what we can do for you.
© 2015 – Timothy Riecker
Emergency Preparedness Solutions, LLC

3 thoughts on “Measuring Return on Investment in Emergency Management and Homeland Security: Improving State Preparedness Reports”